Performance of European Countries Against the SDGs
Part 2
Since 2019, the Europe Sustainable Development Report has presented the SDG Index and Dashboards for Europe and provided an annual overview of the European Union’s progress towards the SDGs, as well as the progress of 38 individual European countries (including all EU countries, EU candidate countries, and regional partner countries). The report highlights areas of success as well as opportunities for further improvement and uses the data to compare the progress of European sub-regions. The data and findings build on several rounds of consultations with scientists, experts and practitioners from across Europe, made possible in large part through the strong cooperation between the UN Sustainable Development Solutions Network (SDSN) and the European Economic and Social Committee (EESC).
This year’s edition covers the 27 EU member states, 6 EU candidate countries (Albania, Bosnia and Herzegovina, the Republic of North Macedonia, Montenegro, Serbia, and Türkiye), the 4 countries of the European Free Trade Association (Iceland, Liechtenstein, Norway and Switzerland), and the United Kingdom. Georgia, Moldova, and Ukraine are not included in this year’s edition due to their recent status as candidate countries and significant data gaps and lags. Detailed country profiles summarize the findings at EU and national levels.
The methodology of the ESDR is based on the global edition of the Sustainable Development Report. This methodology has been peer-reviewed by Cambridge University Press and Nature Geoscience, and statistically audited in 2019 by the European Commission Joint Research Centre.1 The 2023/24 SDG Index for Europe comprises 109 indicators, derived from official and non-official statistics: for 95 of these, we have been able to evaluate progress made towards the SDG targets over time – from 2015 until the most recent data point available. Annex 1 provides more details about the methodology.
The database and data visualisation portals, as well as other tools and analytics to explore SDG pathways, policies and financing, are accessible on SDSN’s SDG Transformation Center portal (www.sdgtransfromationcenter.org).
The average SDG Index score of EU countries in 2023 is 72 percent (Figure 1). This highly aggregated average may be sensitive to outliers and does not reflect trends over time. It is therefore also interesting to look at the results in terms of targets achieved or on track to be achieved. Halfway into the SDGs, we estimate that the EU has achieved or is on track to achieve a little over two-thirds of the SDG targets (Figure 2).
Figure 2.1 | Performance on the SDG Index: EU average and performance across European countries, 2010–2022

Note: The colored dots correspond to the average SDG Index scores of the 34 countries included in this year’s Europe Sustainable Development Report.
Source: Authors

The EU average masks important disparities across European sub-regions and countries. The average SDG Index score ranges from more than 80% in some of the Northern European countries to around 60% in some of the Eastern European countries and 50% in some of the candidate countries. Less than one-third of the SDG targets have been achieved or are on-track to be achieved in candidate countries.
SDG progress in Europe has stalled since 2020. Even before the pandemic hit, progress in the EU was too slow to achieve all of the SDGs by 2030. Still, progress on the SDG Index was three times as fast over the period 2015–2019 (0.73 points per year) than over the period 2019–2022 (0.24 points per year) (Figure 3). Global SDG progress has also stalled since 2020 due to multiple crises, with some of the poorest and most vulnerable regions in the world showing reversals in SDG progress.2

Note: The pre-pandemic trend projection is extrapolated from the 2015–2019 SDG Index growth rate.
Source: Authors
The 2023/24 SDG Index for Europe is topped by Northern European countries. Finland ranks first for the fourth year in a row, followed by Sweden and Denmark – which all have scores close to or above 80 (out of 100). Finland also topped the 2023 global SDG Index and is, according to the World Happiness Report 2023, the happiest country in the world.3 Yet the SDG dashboards show that even these countries face major challenges (red dashboard rating) in achieving at least two goals.

Building on this year’s dashboards and previous editions, we underline five major SDG challenges faced by the EU:
1. Multiple crises since 2020, which have led to stagnation and even reversal of progress on Leave-No-One-Behind indicators, especially measuring within-country inequalities
2. Persisting challenges related to environmental and biodiversity goals, including sustainable food and land systems (SDG 2, SDGs 12–15)
3. Negative impacts from unsustainable consumption and supply chains via international spillover effects
4. Large gaps and a slow pace of convergence in SDG outcomes across European countries
5. Slow progress: although some headway has been made on SDG goals and targets since 2015, overall progress is too slow to achieve all of the SDGs by 2030 (progress was already too slow even before 2020)

The SDGs call for addressing inequalities within and across countries. The ‘leave no one behind’ principle, which is incorporated into the SDGs and the 2030 Agenda, is commonly invoked in reference to inequalities within each country. SDG 10 (Reduced inequalities) and SDG 17 (Partnerships for the goals) call for reducing inequalities across countries, and for increased partnerships. In Europe and by EU leadership, this is generally referred to as ‘convergence’.
The case for addressing both types of inequalities, within and across countries, has been reinforced by the COVID-19 pandemic and by the threats posed by geopolitical tensions and climate change, including rising energy and food prices that disproportionally affect the most vulnerable countries and population groups. The promotion of economic and social convergence among EU member states is at the core of the European project. This is more important than ever in the context of increasing geopolitical tensions and major crises, where EU-wide unity and solidarity are needed for decisive and swift actions.
To measure inequalities within countries, including their evolution over time, SDSN has developed a ‘leave no one behind’ – or LNOB – index for European countries (Box 1). From a global perspective, the EU is among the most equal regions in the world, offering the most advanced social protection system and universal access to basic services. The European version of the LNOB Index aims to capture persisting gaps and differences across European countries and to identify areas where policymakers must remain vigilant, due for instance to stagnation or reversal of progress in recent years.
The LNOB Index measures inequalities within countries. It is composed of a subset of 32 indicators (all also used in the overall SDG Index and Dashboards) and reflects the progress of European countries on four main dimensions of inequality:
• Extreme poverty and material deprivation (e.g. poverty after social transfers, and disparities in health insurance coverage)
• Income inequality and respect for fundamental labour rights
• Gender inequality (e.g. gender pay and employment gaps, under-representation of women in leadership roles in the public and private sectors)
• Access to and quality of services (e.g. disparities across population groups in relation to key services including education and health)
The LNOB index is scored on a scale of 0 to 100, where higher scores represent better performance and therefore less inequality. More information on indicator sources and aggregation is accessible in the Methods’ summary section.
Northern European countries obtain the highest scores on the 2023/24 European LNOB Index (Figure 6). Norway, Iceland and Finland are at the top of the index, with scores above 85 percent – mainly driven by low levels of income inequality and material deprivation in these countries. On the other hand, stark within-country inequalities are seen in the Baltic States and Central and Eastern European countries, which appear at the bottom of the 2023/24 Europe LNOB Index (with average scores of around 70). EU candidate countries face many difficulties in catching up with Europe in terms of the LNOB index, primarily due to their much higher rates of material deprivation and poverty.

Since the adoption of the SDGs, most European countries have made some progress in terms of the LNOB principle, although progress has stalled on a number of its dimensions since 2019. Central and Eastern European countries have advanced the most overall. Since 2019, however, only the LNOB sub-pillar related to gender equality has shown any significant progress. This shift has been driven by an increasing share of women in parliament and in management positions in many EU countries, including in countries starting from very low levels. Still, no EU country has fully achieved SDG 5 (Gender equality).
A majority of European countries show no progress, or even a reversal in progress, on three out of four LNOB sub-dimensions (Figure 7). The situation is particularly alarming with regards to ‘access and quality of services’, where 32 of the 34 European countries covered by the Index show no progress or reversal in progress. This is partly driven by unequal health, education, and safety outcomes across population groups. Even countries that have been performing rather well, however, should remain vigilant to potential reversals of progress on LNOB in 2024, in the context of rising inflation and uncertain geopolitical and economic conditions globally and in Europe. Previous editions of this report have discussed the relationship between LNOB and sustainable development at large.4

Note: This chart focuses on the period 2019–2022 and covers the 34 countries with sufficient data to produce index scores. We consider a 1 percentage point increase in the LNOB score over the period as ‘progress’, a score change between – 1 and 1 as ‘stagnation’, and a 1 percentage point decrease as ‘decline’. A 1-point increase for countries starting from very low levels of equality may not reflect rapid progress, however, compared with a 1-point increase in a country starting from higher levels of equality.
Source: Authors
SDSN and its partners have been documenting territorial inequalities in SDG performance for some years now. The SDG Indices and Dashboards reports for individual cities and regions underline differences in SDG achievements within countries and territories (Figure 8). SDSN Networks have published assessments for Greek, Italian and Spanish cities, and also for cities and regions in Benin, Brazil, Malaysia and the United States, among others.5 These tools provide a more comprehensive overview of SDG gaps and challenges at the territorial level.
The spread in performance on certain goals across European countries is still significant, suggesting that the convergence process remains too slow (or is driven mainly by large cities). As an example, SDG 9 (Industry, innovation and infrastructure) is at once the goal for which the greatest number of countries score ‘green’ on the dashboards (very high performance) and the one showing the most ‘red’ scores (very poor performance). Strengthening EU performance on SDG 9 will be key to improving productivity and living standards across the continent.
The climate and biodiversity crises are driven by domestic action, but they are also impacted by activities that extend beyond national borders: through trade and other cross-border activities. In addition to environmental spillovers, which are driven by international trade and domestic policies, countries also generate economic, financial, social, and security spillovers.
The 2030 Agenda and the SDGs recognize the importance of international spillovers in several crucial ways. SDG 17 (Partnerships for the goals) calls for ‘policy coherence’ for sustainable development, SDG 12 (Responsible consumption and production) stresses the need for more sustainable production and consumption, and SDG 8 (Decent work and economic growth) demands the eradication of child labour and modern slavery. The SDSN, working with partners, has from the start incorporated international spillovers in our assessment of countries’ progress towards the SDGs. This can explain certain differences in SDG Index results compared with those of other SDG monitoring instruments.6

Compared with other world regions, the EU – and OECD countries in general – tends to generate relatively large negative spillover effects. These are driven primarily by unsustainable supply chains, which lead to deforestation and other negative environmental and social impacts, serving the consumption needs of EU and OECD countries. Figure 10 describes trade-related impacts that can be attributed to specific consumer goods or services across sectors, building on SDSN et al (2023). In some European countries, unfair tax competition, tax havens and shifted profits of multinationals also explain relatively low (poor) international spillover scores.
Figure 2.10 | Trade-related spillover impacts from EU demand, by impact area and final consumer goods or services (top ten, %)
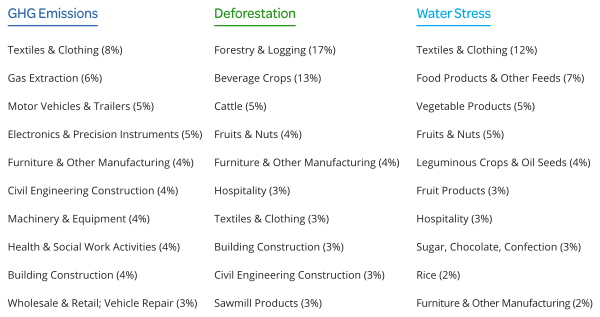
Source: SDSN, Yale University and the University of Tokyo (2023)
Curbing trade-related spillovers is a matter of making trade more sustainable and more consistent with the objectives of the Paris Agreement, the Global Biodiversity Framework, the High Seas Treaty and the SDGs – rather than simply restricting trade, which plays such a massive role in enabling developing countries to generate employment and socioeconomic development. Success requires a combination of better metrics and policies in importing countries coupled with support to exporting countries (particularly tropical forest countries) to transition towards more environmentally sustainable technologies and development paths. Both sides – importers and exporters – must work closely together in partnership to tackle this shared challenge.7
Since 2017, the SDSN, in collaboration with various partners, has published numerous scientific articles and policy briefs exploring possible policy pathways to curb the negative spillovers generated by specific supply chains and countries.8 In September 2023, the Villars Framework for a Sustainable Trade System9 made eight recommendations for a comprehensive reform agenda for the World Trade Organization and the international trade system.
The 2023/24 European Spillover Index comprises 14 indicators that are all included in the overall SDG Index. It measures Europe’s progress in reducing environmental and social spillovers embodied in trade, spillovers related to economic and financial flows across countries, and peacekeeping and security spillovers.
SDSN is working with partners to strengthen the availability and timeliness of data on international spillovers, including through flagship initiatives such as the Global Commons Stewardship Index, which measures countries’ impacts beyond domestic concerns and specific supply chains studies, focusing for instance on food, textile and minerals.
Conceptually, international spillovers in the context of the SDGs can be grouped into four categories:
• Environmental and social spillovers embodied in trade. These cover international impacts related to pollution and the use of natural resources, as well as social impacts generated by the consumption of goods and services. Multi-regional input–output (MRIO) models, combined with satellite datasets, provide powerful tools to track impacts generated worldwide by consuming countries. This category of spillovers also includes exports of toxic pesticides and the illegal wildlife trade. They are particularly connected to SDG 8 (Decent work and economic growth), SDGs 12 through 15 (related to responsible consumption, climate and biodiversity), and SDG 17 (Partnerships for the goals). They also indirectly affect all other SDGs.
• Spillovers related to economic and financial flows. These include unfair tax competition, corruption, banking secrecy, profit shifting, tax havens and stolen assets, which all undermine the capacity of other countries to leverage resources to achieve the SDGs. They also include positive spillovers (or handprints) such as international development finance (for example, ODA). These types of spillovers are closely related to SDG 16 (Peace, justice and strong institutions) and SDG 17 (Partnerships for the goals) – and indirectly to all other SDGs, notably through ODA.
• Peacekeeping and security spillovers. These include negative externalities such as organized international crime or exports of major conventional weapons or small arms, which can have a destabilizing impact on poor countries. Among the positive spillovers in this category are investments in conflict-prevention and peacekeeping. These spillovers are particularly related to SDG 16 (Peace, justice and strong institutions) and SDG 17 (Partnerships for the goals), but also indirectly connected with most of the SDGs, including poverty, hunger and health as well as other socio-economic goals.
• Direct cross-border flows in air and water. These cover effects generated through physical flows – for instance of air and water – from one country to another. Cross-border air and water pollution are difficult to attribute to a country of origin, and this remains an important data gap. Unfortunately, the International Spillover Index does not currently include any indicators to track these types of spillovers. They are particularly related to SDG 6 (Clean water and sanitation) and SDGs 12–15 on climate and biodiversity, but they also concern many other goals, including SDG 3 (Good health and well-being).
Further details on indicator sources and aggregation for the International Spillover Index are provided in the methodology annex and online.
Andersen, L., S. Canelas, A. Gonzales Rocabado, L. Peñaranda (2020). Atlas Municipal de los Objetivos de Desarrollo Sostenible en Bolivia 2020. Universidad Privada Boliviana, SDSN Bolivia.
Cavalli, L. and L. Farnia (2018). Per un’Italia sostenibile: l’SDSN Italia SDGs City Index 2018. Sustainable Development Solutions Network (SDSN) and Fondazione Eni Enrico Mattei: https://www.feem. it/en/publications/per-unitalia-sostenibile-lsdsn- italia-sdgs-city-index-2018/
De la Mothe Karoubi, E., S. Touré, G. Lafortune and G. Fuller (2022). Benin Sustainable Development Report 2022
Espey, J., H. Dahmm, and L. Manderino (2018). Leaving No U.S. City Behind: The U.S. Cities Sustainable Development Goals Index. Sustainable Development Solutions Network (SDSN): https://www.unsdsn. org/news/2018/06/08/leaving-no-u-s-city-behind- the-2018-u-s-cities-sdgs-index
Fuller, G. and L. Bermont-Diaz (2024). International Spillover Effects and Germany: An analysis of Germany’s performance on spillovers and the policy options to manage them. Paris: SDSN, 2024: https://sdgtransformationcenter.org/reports/ international-spillover-effects-and-germany
Helliwell, J. F., R. Layard, J. D. Sachs, J.-E. De Neve, L. B. Aknin, and S. Wang (2023). World Happiness Report 2023. Sustainable Development Solutions Network (SDSN).
Ishii, N., G. Schmidt-Traub, G. Lafortune, J. Franke, F. Cornehl and A. von Preussen (2023). Tackling International Spillovers: An Overview of Policy Options. The Center for Global Commons at Tokyo University: https://cgc.ifi.u-tokyo.ac.jp/wp-content/ uploads/2023/12/cgc_spillovers.pdf
Lafortune G, M. Cortés Puch, A. Mosnier, G. Fuller, M. Diaz, A. Riccaboni, A. Kloke-Lesch, T. Zachariadis, E. Carli, A. Oger (2021). Europe Sustainable Development Report 2021: Transforming the European Union to achieve the Sustainable Development Goals. SDSN, SDSN Europe and IEEP, France: Paris.
Lafortune, G., G. Fuller, G. Schmidt-Traub and C. Kroll (2020). ‘How is progress towards the sustainable development goals measured? Comparing four approaches for the EU’. Sustainability 2020, 12(18), 7675; https://doi.org/10.3390/su12187675
Lafortune, G., K. Zoeteman, G. Fuller, R. Mulder, J. Dagevos and G. Schmidt-Traub (2019). SDG Index and Dashboards Report for European Cities. Sustainable Development Solutions Network (SDSN) and the Brabant Center for Sustainable Development: https://resources.unsdsn.org/sdg-in- dex-and-dashboards-report-for-european-cities
Malik, A., G. Lafortune, C. J Mora, S. Carter and M. Len (2022). International Spillovers Embodied in the EU’s Supply Chains: Tracking Forced Labour, Accidents at Work and Climate Impacts in the EU’s Consumption of Fossil and Mineral Raw Materials. GIZ, SDSN and University of Sydney: https://irp.cdn-website. com/be6d1d56/files/uploaded/56690-1%20-%20 SDSN%20Study%20-%20v3.pdf
Malik, A., G. Lafortune, S. Carter, M. Li, M. Lenzen and C. Kroll (2021a). ‘International spillover effects in the EU’s textile supply chains: A global SDG assessment’. Journal of Environmental Management 295: https://doi.org/10.1016/j.jenvman.2021.113037
Malik, A., G. Lafortune, S. Dahir, Z. A. Wendling, S. Carter, M. Li and M. Lenzen (2021b). Making Globalisation and Trade Work for People and Planet: International Spillovers Embodied in the European Union’s (EU’s) Food Supply Chains.
Papadimitriou, E., A. F. Neves, and W. E. Becker (2019). JRC Statistical Audit of the Sustainable Development Goals Index and Dashboards. European Commission. https://ec.europa.eu/jrc/en/ publication/jrc-statistical-audit-sustainable-devel- opment-goals-index-and-dashboards.
Sachs, J., C. Kroll, G. Lafortune, G. Fuller and F. Woelm (2022). From Crisis to Sustainable Development, the SDGs as Roadmap to 2030 and Beyond: Sustainable Development Report 2022. Cambridge University Press. https://doi.org/10.1017/9781009210058, https://www.sdgindex.org/reports/ sustainable-development-report-2022/
Sachs, J.D., G. Lafortune, G. Fuller, E. Drumm (2023). Implementing the SDG Stimulus: Sustainable Development Report 2023. Paris: SDSN, Dublin: Dublin University Press, 2023. 10.25546/102924
Schmidt-Traub, G., C. Kroll, K. Teksoz, D. Durand-Delacre and J. D. Sachs (2017). ‘National baselines for the sustainable development goals assessed in the SDG Index and Dashboards’. Nature Geoscience 10 (8): 547–55. https://doi.org/10.1038/ngeo2985.
SDSN, Yale University and the University of Tokyo (2023). Global Commons Stewardship Index 2022: Tackling Environmental Spillovers. SDSN, Yale Center for Environmental Law & Policy, and Center for Global Commons at the University of Tokyo: https://gcsi.unsdsn.org/
Trachtman, J. P., J. Y. Remy, D. Esty and T. Sutton (2023). Villars Framework for a Sustainable Global Trade System. Remaking Trade for a Sustainable Future, https://remakingtradeproject.org/ villars-framework
The Europe Sustainable Development Report 2023/24 is the fifth edition of our independent quantitative report on the progress of the European Union and its member states towards Sustainable Development Goals (SDGs). The report was prepared by teams of independent experts at the Sustainable Development Solutions Network (SDSN) and SDSN Europe.
Citation
Guillaume Lafortune, Grayson Fuller, Adolf Kloke-Lesch, Phoebe Koundouri and Angelo Riccaboni (2024). European Elections, Europe’s Future and the SDGs: Europe Sustainable Development Report 2023/24. Paris: SDSN and SDSN Europe and Dublin: Dublin University Press, https://doi.org/10.25546/104407